Statistics Lesson Plans

How to teach Statistics using Mangahigh - interpret data from different sources

Get your students engaged with interpreting data from different sources through the use of Mangahigh’s adaptive quiz ‘Interpret data from different sources’. Students will start with ‘Easy’ questions to help introduce new ideas and then move onto ‘Medium’ questions with some scaffolded support. Students then progress onto ‘Hard’ questions that really test their understanding, and the most able will move on to ‘Extreme’ questions that will challenge even the brightest students.
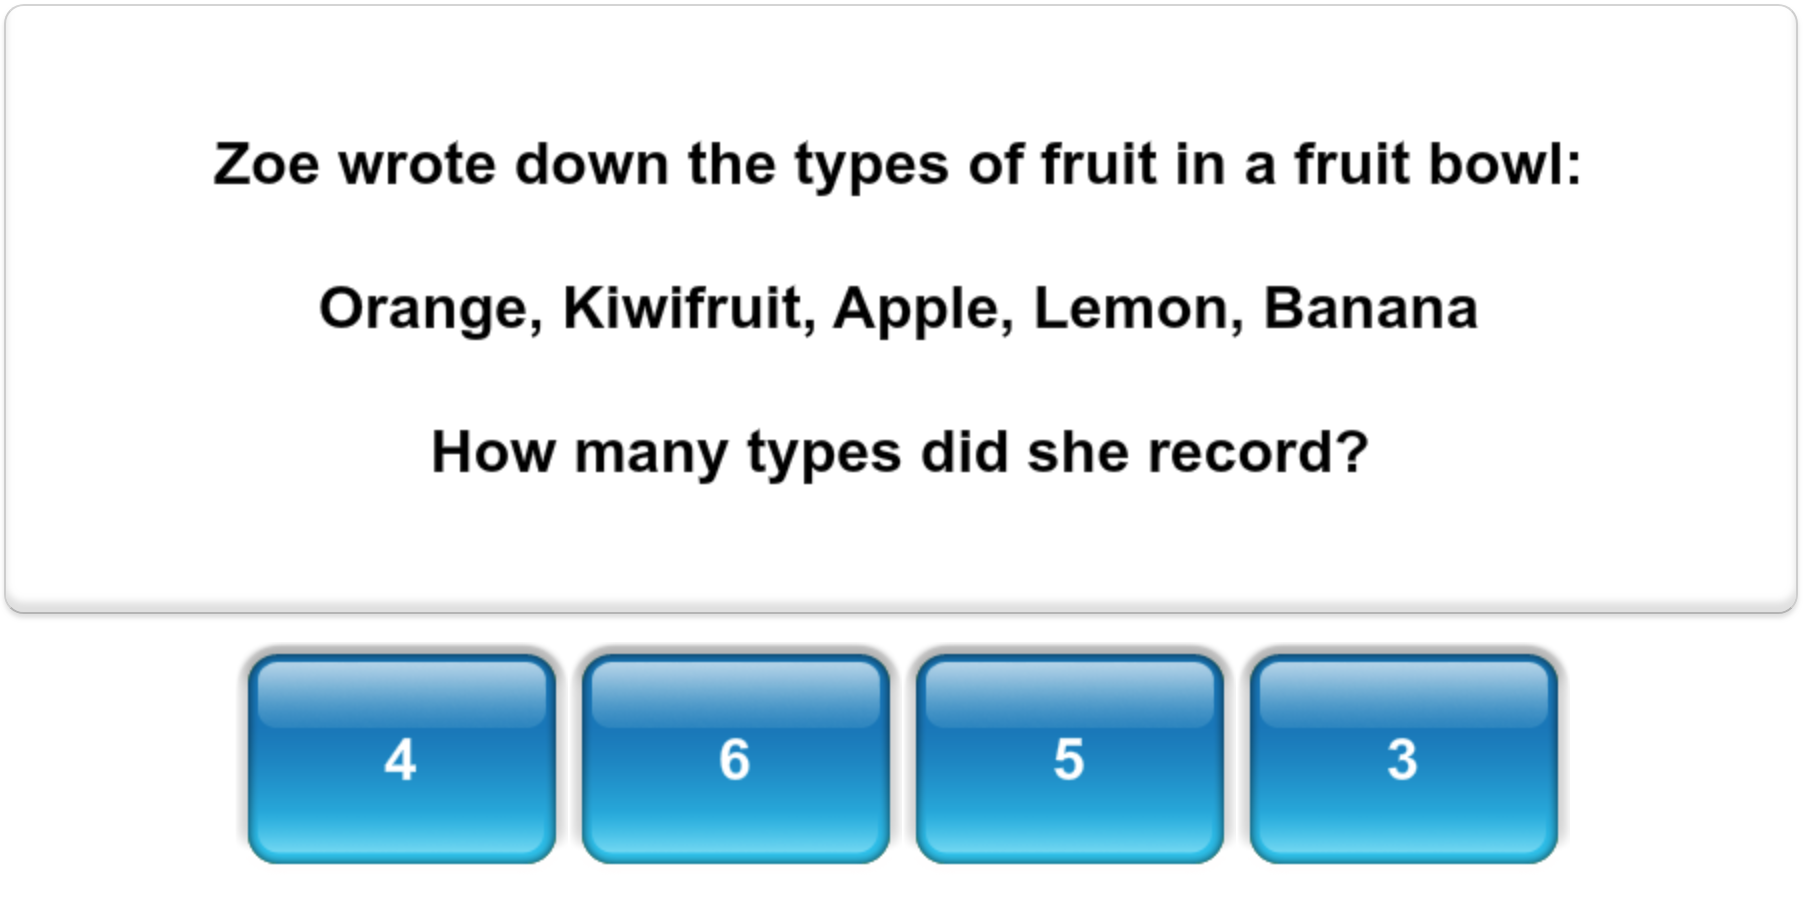
Lesson idea for teaching 'interpret data from different sources'

Example of blended learning lesson

55 mins
  • Discuss what these charts are and what information they are showing, covering briefly how they can look different but show the same information.
    pie chart and bar chart
  • Set the Mangahigh activity ‘Interpret data from different sources’. Each time students play through the activity they will answer 10 questions. Encourage students to make at least three attempts, i.e. attempt at least 30 questions. Students will receive a bronze medal award and thus demonstrate they have a secure understanding if they can prove their competency at the hard questions. The most able students might achieve a silver or gold medal by answering extreme questions. Move through the class offering help where needed and challenge students to explain their solutions. Use your Mangahigh analytics platform to check progress and support struggling students.
  • Play through the activity ‘Interpret data from different sources’ from your Mangahigh teacher platform on the whiteboard with the whole class. Challenge students to explain their solutions.
  • Students return to the ‘Interpret data from different sources’. For the most able, set an additional activity ‘Use the range and mode’. Use your Mangahigh analytics platform to identify any students who have struggled with the first activity ‘Interpret data from different sources’ and support them or encourage them to work with their peers.
  • Discuss what these charts are and what information they are showing, covering briefly how they can look different but show the same information.
    pie chart

How to teach Statistics using Mangahigh - frequency tables

Introduce your students to frequency tables through the use of Mangahigh’s adaptive quiz ‘Frequency tables’. Students will start with ‘Easy’ questions to help introduce new ideas and then move onto ‘Medium’ questions with some scaffolded support. Students then progress onto ‘Hard’ questions that really test their understanding, and the most able will move on to ‘Extreme’ questions that will challenge even the brightest students.

Lesson idea for teaching frequency tables

Example of blended learning lesson

55 mins
  • On the whiteboard show a calendar for the current month, ask the students if anyone has a birthday in this month and add it to the calendar. Discuss how many days you are to or from the students birthdays and how many days difference there are between two students birthdays.
  • Set the Mangahigh activity ‘Use calendars and dates’. Each time students play through the activity they will answer 10 questions. Encourage students to make at least three attempts, i.e. attempt at least 30 questions. Students will receive a bronze medal award and thus demonstrate they have a secure understanding if they can prove their competency at the hard questions. The most able students might achieve a silver or gold medal by answering extreme questions. Move through the class offering help where needed and challenge students to explain their solutions. Use your Mangahigh analytics platform to check progress and support struggling students.
  • Play through the activity ‘Use calendars and dates’ from your Mangahigh teacher platform on the whiteboard with the whole class. Challenge students to explain their solutions.
  • Students return to ‘Use calendars and dates’. For the most able, set an additional activity ‘Measure time’. Use your Mangahigh analytics platform to identify any students who have struggled with the first activity ‘Use calendars and dates’ and support them or encourage them to work with their peers.
  • Ask students to find the missing values in this table for the expression (3a - b). Students attempt to solve them on paper and find more than one solution if possible.

    Favourite Colour Blue Red Yellow Green Purple Orange Other
    Number of Students

Selection of statistics activities

Curriculum-aligned activities

What teachers say about Mangahigh

We’re loved by both teachers and students globally. Here’s the proof!

Get started now with Mangahigh for free

No credit card required.

Start Trial Now